Enable Visual Analytics
Visual Analytics organizes Poly Lens data in a convenient and flexible way to integrate with your preferred analysis and visualization tools.
Enable Visual Analytics
- Go to the ACCOUNT menu > Manage Accounts.
- Select an Account from the list.
- Select Integrations > Visual Analytics from the side tabs.
- Select Enable Visual Analytics.
- Wait until Visual Analytics is enabled. Once enabled, the credentials needed to integrate Visual Analytics to external systems will be displayed.
Architecture
When you enable Visual Analytics in Poly Lens, Poly deploys a database for you in the Microsoft Azure cloud. Poly Lens populates that database with telemetry events from your Poly Lens account. The database is updated with the latest events once per day. Poly provides you with credentials that allow read-only access to this database. You may then connect your preferred analysis tool to this database to access your telemetry data. Note: The database is not pre-populated. It is updated from device events as they arrive. Consequently, it may take a few days after you enable the integration before the database contains data about all your devices.
Data Organization
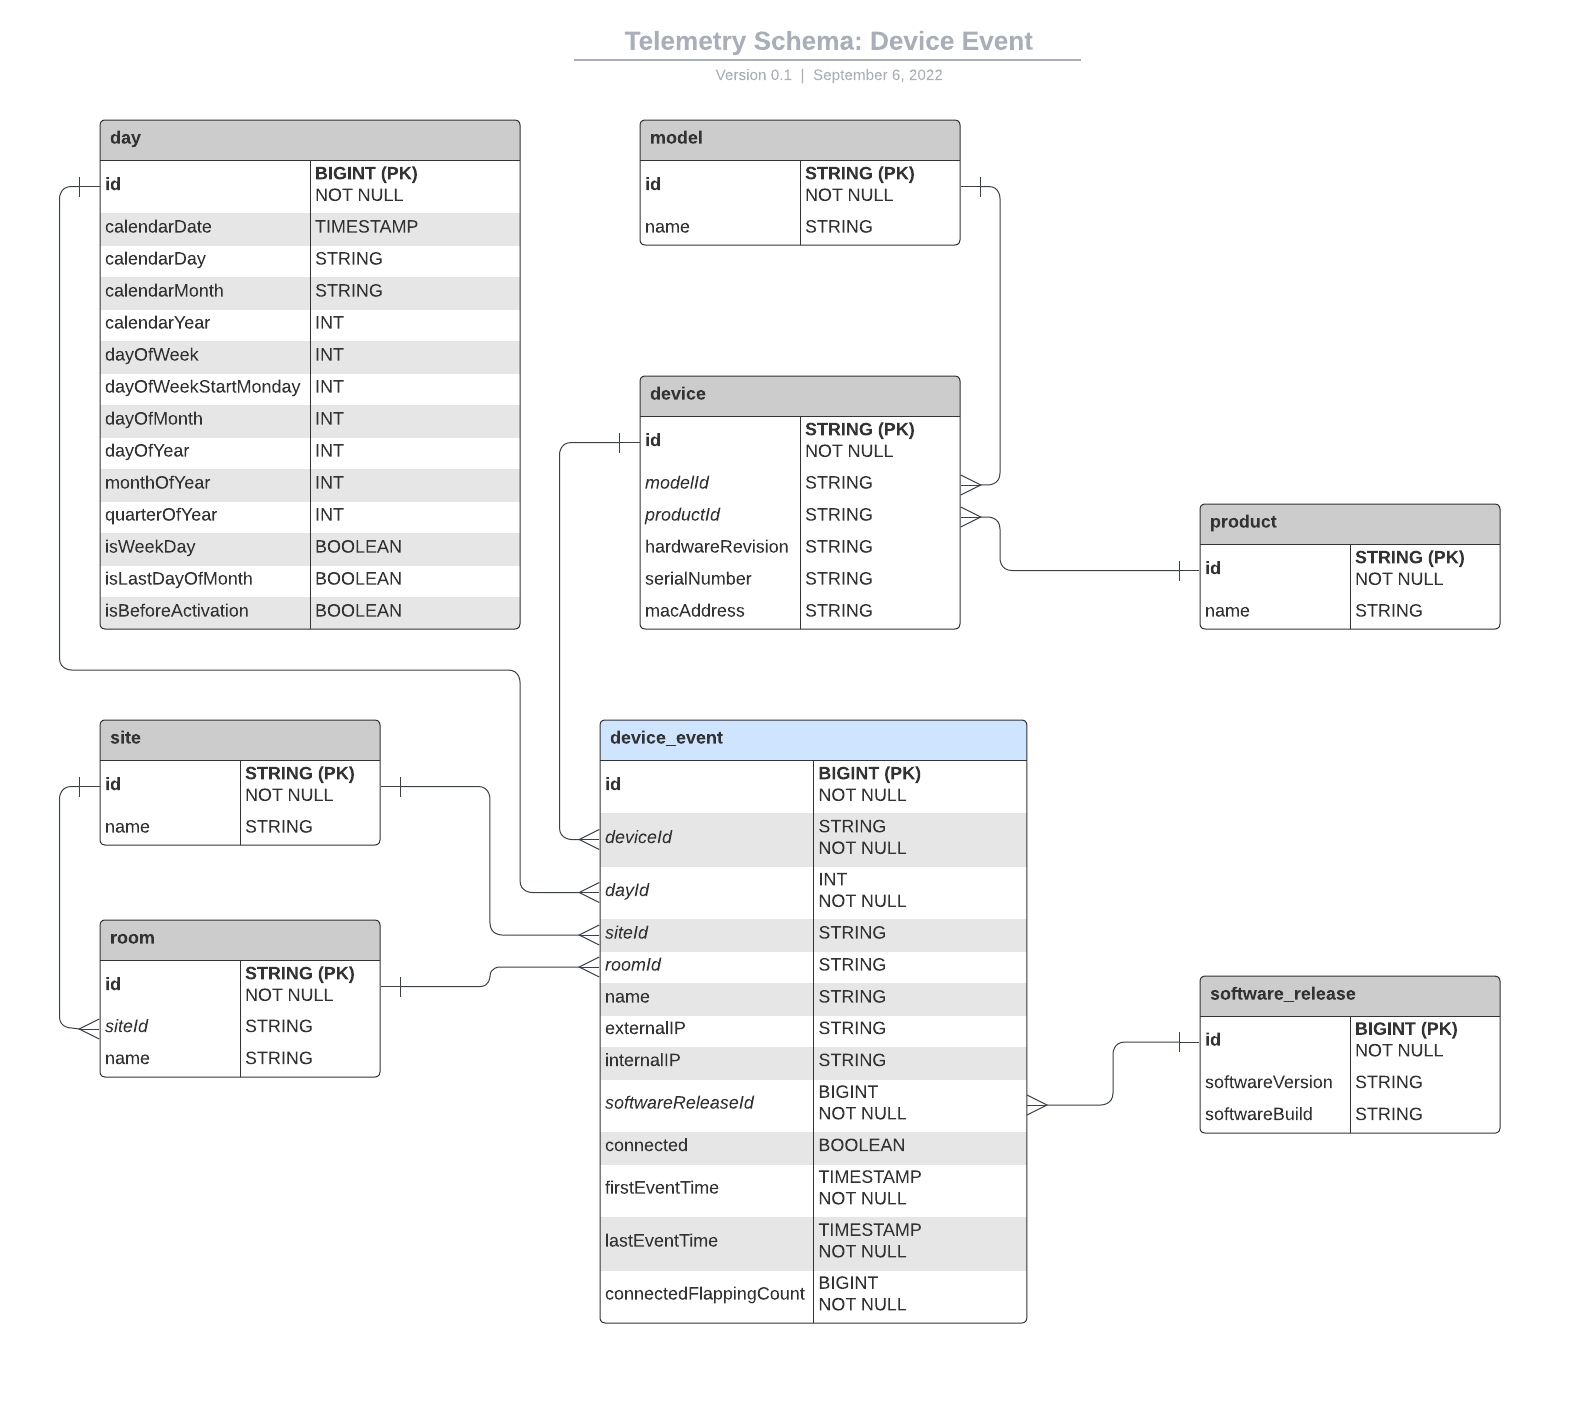
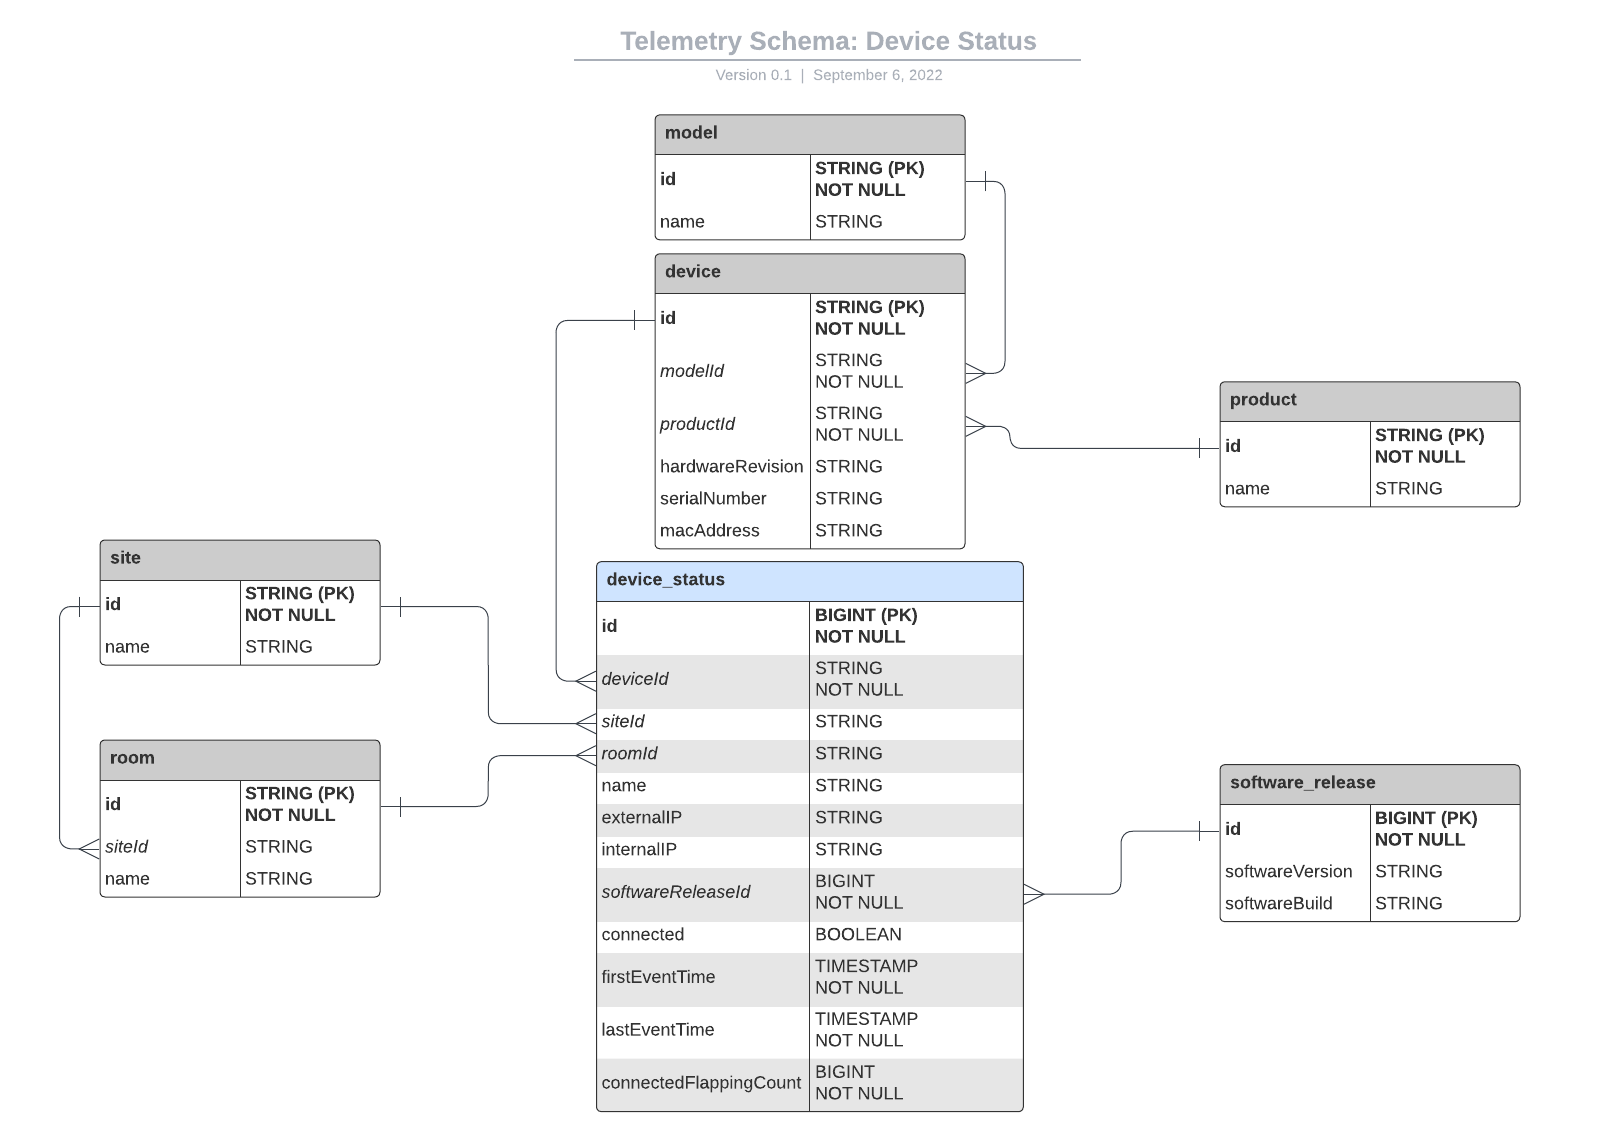
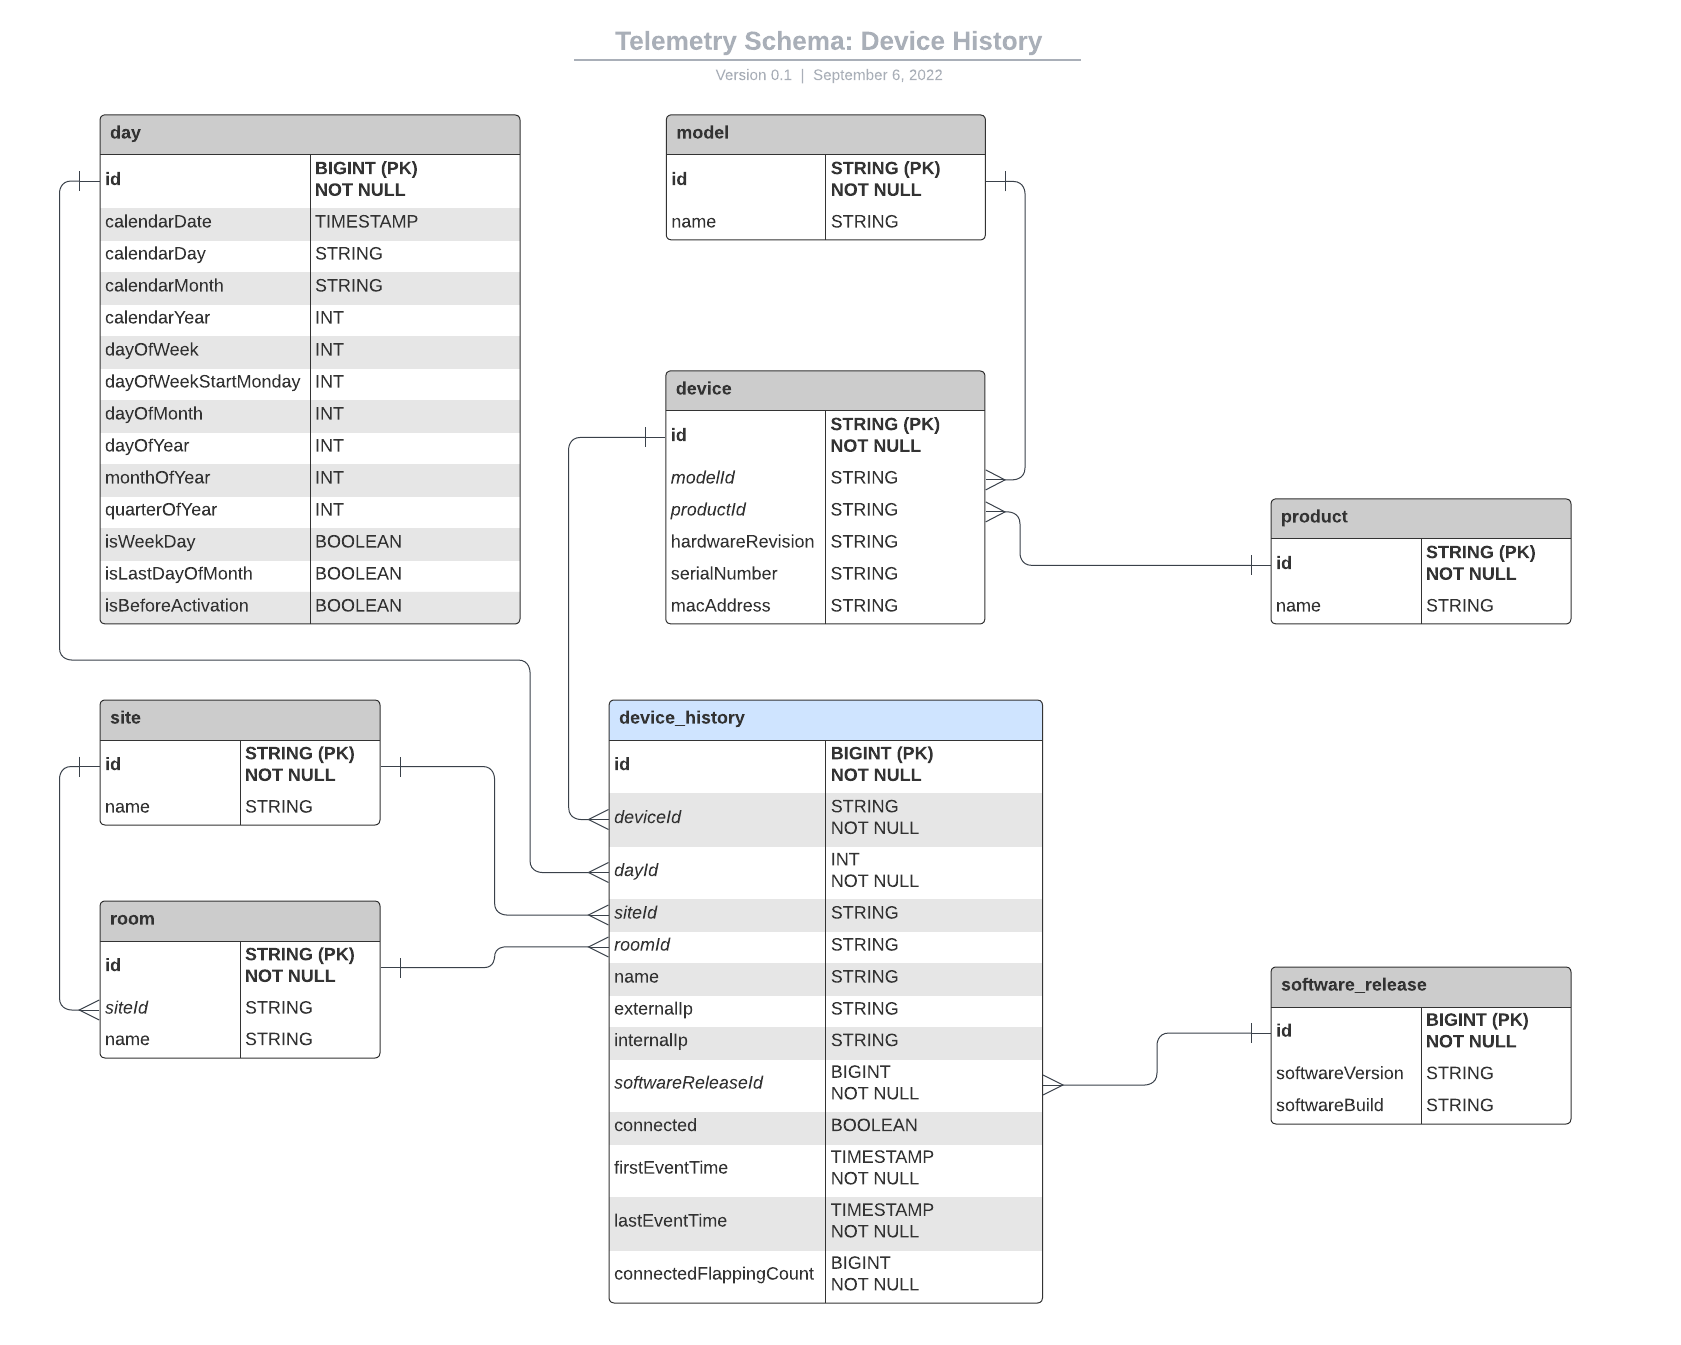
The telemetry database is organized into star schemas for convenient access from popular BI tools. There are three fact tables. The schema is best understood as three different stars, each with a different fact table at its center.
Fact Tables
| Table | Cardinality | Contents | Retention |
|---|---|---|---|
| device_status | One row per device | Most recent status | N/A |
| device_history | One row per device per day | Status of device at the end of the day | 1 Year |
| device_event | One row per device status event | Status at time of event | 60 days |
Dimension Tables
The dimension tables are day, device, model, product, room, site, and software_release.##
Schema Diagrams
Device Status
Device History
Device Event